
The study presented participants with anonymous, plain text posts from politicians, celebrities and brands, who then rated them for a variety of criteria, including trustworthiness, and friendliness.
Here’s what happened
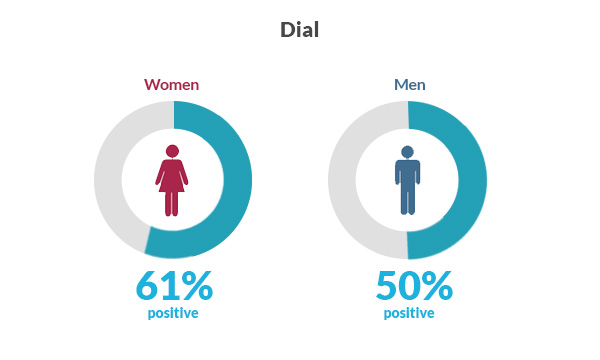
Women generally responded more positively than men to all content.
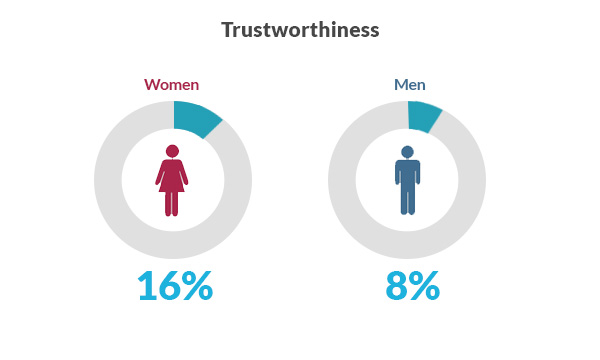
But both genders expressed more trust for content written by the opposite gender.
Positivity dipped slightly for posts written by other women.
Posts written by men had a more positive overall response than posts written by women.
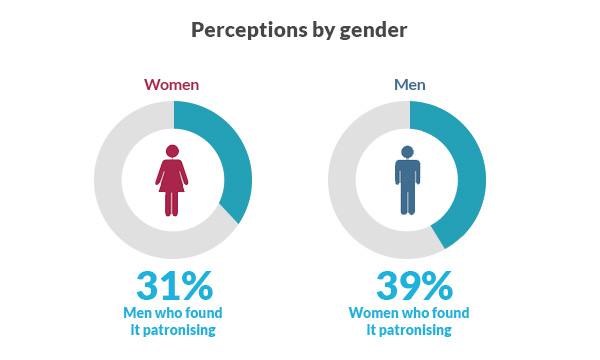
But when asked to rate content on how patronising it was, something interesting happened.
Both genders felt more patronised by content written by the opposite sex. Even though they didn’t know who the author was.
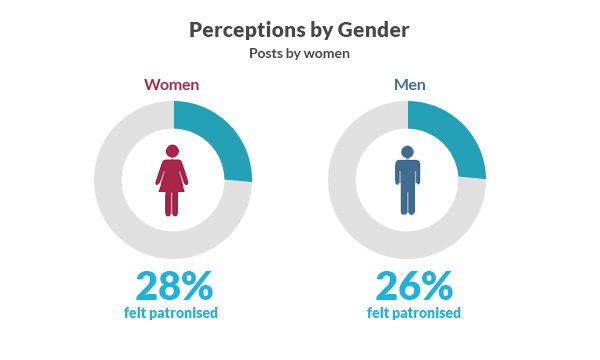
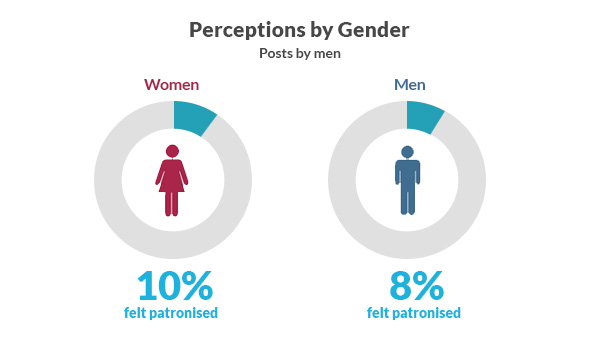
But women were more likely than men in general to find a post patronising.
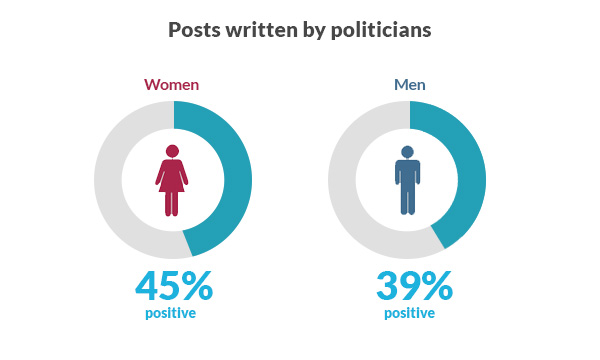
Political content
Posts by politicians, including David Cameron, Douglas Carswell, Diane Abbot and Stella Creasey, although more likely to be focus-grouped and strategised, got a higher than average approval rating across the genders. But women were 6% were positive about political posts than men.
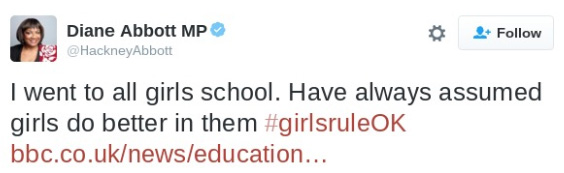
But a tweet by Diane Abbott’s Tweet was ranked as the most patronising of all content in the study.
‘I went to all girls school. Have always assumed girls do better in them #girlsruleOK’
An angry post written by UKIP’s Douglas Carswell also divided opinion.
Some men found it friendly. In fact three times as many men than women rated this Tweet as ‘friendly’.
Brand accounts
Posts written by brands were the best received generally. Women were 11% more likely to respond positively to brand content. Social media accounts in the banking and finance industries scored the best overall.
But brand content was also the most divisive between genders.
This post by British Gas promoting women in science, technology, engineering and maths caused one of the biggest differences in reaction between the genders.
“Inspired by #GirlsinSTEM? Meet 5 women fighting against engineering gender stereotypes”
Men were half as likely as women to trust this content.
The biggest gender difference was in reaction to an Instagram post by singer Paloma Faith.
“The homeless always take such good care of their companions it’s very moving”
10% of men said they found the content untrustworthy, compared to just 2% of women.
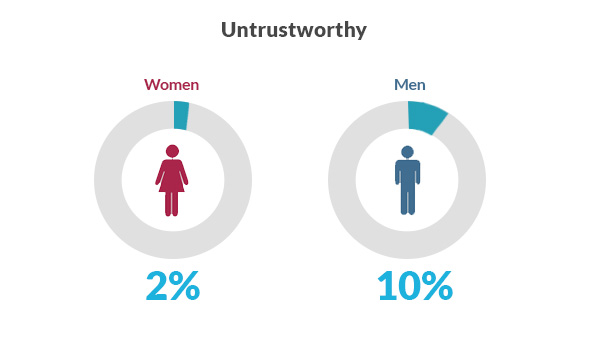
Although one third from both genders agreed that the post was patronising.
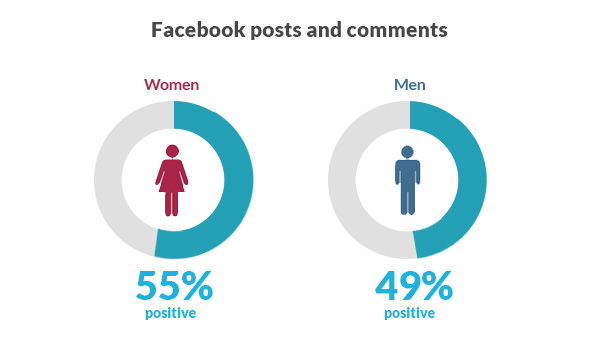
By channel, Facebook was the clear winner for positivity.
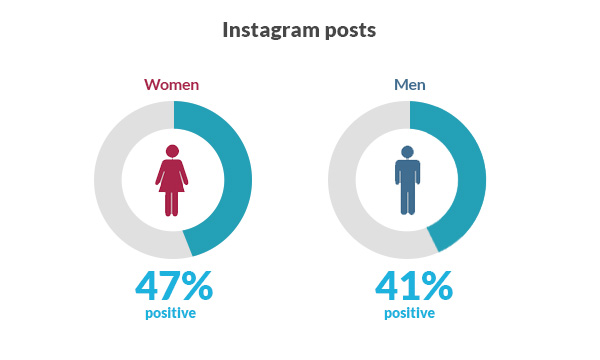
Followed by Instagram
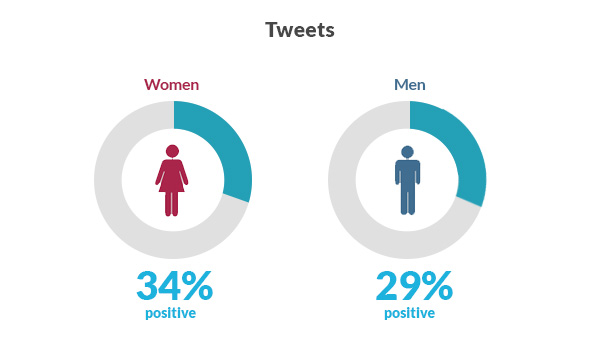
Twitter was got the lowest proportion of positive responses.
General perceptions of social media posts
| Male | Female | Male | Female | Male | Female | Male | Female |
|---|---|---|---|---|---|---|---|
| positive | positive | trustworthy | trustworthy | patronising | patronising | negative | negative |
| 38.511 | 44.4 | 25.93 | 25.46 | 15.24 | 16.58 | 10.96 | 12.46 |
Perceptions of social media posts written by brands
| 50.0 | 60.9 | 10.6 | 9.13 | 9.81 | 13.31 | 5.3 | 7.8 |
|---|---|---|---|---|---|---|---|
| Male positive |
Female positive |
Male trustworthy |
Female trustworthy |
Male patronising |
Female patronising |
Male negative |
Female negative |
Perceptions of social media posts written by women
| 27.8 | 32.7 | 4.45 | 3.97 | 27.55 | 26.35 | 13.21 | 14.112 |
|---|---|---|---|---|---|---|---|
| Male positive |
Female positive |
Male trustworthy |
Female trustworthy |
Male patronising |
Female patronising |
Male negative |
Female negative |
Perceptions of Tweets written by men
| 37.64 | 39.53 | 9.12 | 9.13 | 8.3 | 10.06 | 9.8 | 11.12 |
|---|---|---|---|---|---|---|---|
| Male positive |
Female positive |
Male trustworthy |
Female trustworthy |
Male patronising |
Female patronising |
Male negative |
Female negative |
Perceptions of social media posts written by politicians
| 39.18 | 44.50 | 9.095 | 8.59 | 16.04833333 | 16.05166667 | 10.62388889 | 11.465 |
|---|---|---|---|---|---|---|---|
| Male positive |
Female positive |
Male trustworthy |
Female trustworthy |
Male patronising |
Female patronising |
Male negative |
Female negative |
Perceptions of Instagram posts
| 40.79 | 46.97833333 | 5.62 | 6.228333333 | 16.69833333 | 17.455 | 8.673888889 | 10.08444444 |
|---|---|---|---|---|---|---|---|
| Male positive |
Female positive |
Male trustworthy |
Female trustworthy |
Male patronising |
Female patronising |
Male negative |
Female negative |
Perception of Facebook posts
| 48.586 | 55.282 | 12.63 | 11.336 | 14.308 | 17.412 | 7.887333333 | 9.951333333 |
|---|---|---|---|---|---|---|---|
| Male positive |
Female positive |
Male trustworthy |
Female trustworthy |
Male patronising |
Female patronising |
Male negative |
Female negative |
Perceptions of Tweets
| 29.36285714 | 34.41714286 | 6.932857143 | 5.631428571 | 14.64571429 | 15.22571429 | 11.29571429 | 12.5952381 |
|---|---|---|---|---|---|---|---|
| Male positive |
Female positive |
Male trustworthy |
Female trustworthy |
Male patronising |
Female patronising |
Male negative |
Female negative |
The study was conducted by Artios. using a nationally representative sample of 1,000 UK adults, who each analysed 18 randomly-selected pieces of content from popular social media accounts on a 6 different criteria.
The content analysed was published in 2015/2016.
Content tested was from an even split of male/female authors. There was an even split of right wing/left wing male/female politicians, including at least one account from Conservative, Labour, Liberal Democrat and UKIP politicians.